A Better Way To
Analyze Your Data

Skip Excel exports, ETL pipelines, one-off scripts and expensive visualization tools. DashPanda lets you query, join, transform, visualize and forecast data from all your data sources in seconds... SQL optional.
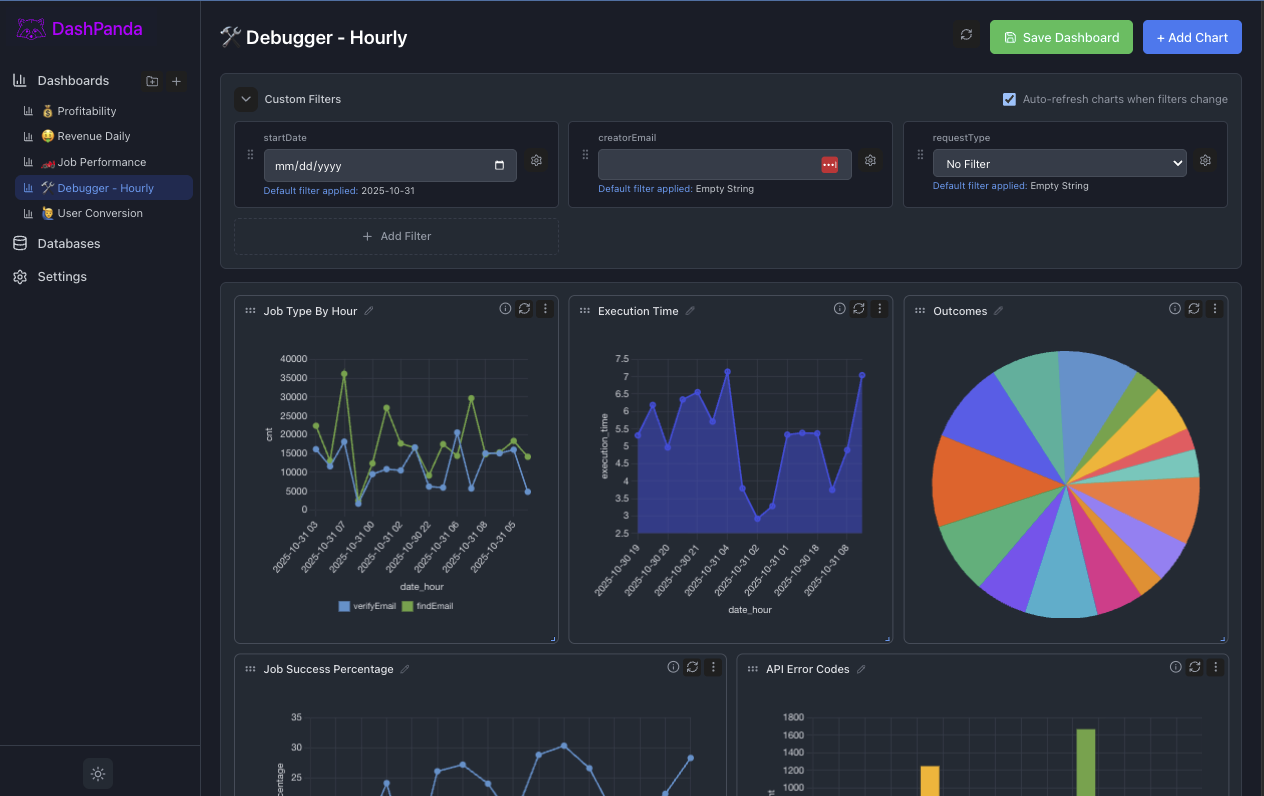
Building Rich, Interactive, Dashboards Has Never Been This Easy

Product screenshot
1. Query & Join Data Across Siloes

Pull data from SQL DBs, third party APIs (eg: CRM, ERP) or Custom endpoints using your report builder of choice (SQL, interactive, AI). Join/collate data on the fly.

2. Shape Your Data

Transform your data with code or AI. The possibilities are endless -- calculate custom columns, create complex rollups and much more.

3. Visualize & Forecast

Build interactive charts and dashboards. Drill down and build data driven forecasts with confidence.

The Analyze Blog

Analytics Tips & Tricks For Everyone